

The buyer's journey is familiar to many, if not all, ecommerce managers. It includes different stages like increasing your potential customers' awareness of your services, getting them to consider buying your products or services, convincing them to buy from you, and finally transforming your buying customer into a returning one.
Running an online shop without following any metrics is like shooting aimlessly with your eyes closed. You might be lucky and hit the target, but you wouldn't know what caused it. Thus, you wouldn't be able to repeat the hit. In this article, we'll walk you through the different stages of measuring your ecommerce business's success.
.jpg?width=1920&name=Blue%20and%20White%20Funnel%20Chart%20Presentation%20(2).jpg)
Each stage comes with different metrics that you can track, offering you data based on which you can better understand your customer's behavior and make informed decisions based on your improved knowledge.
While you can use many good tools to follow and analyze your ecommerce metrics, it can be overwhelming to choose which numbers to follow. The good thing is, you don't have to follow them all. The key is to know which metrics matter the most for your business — and we're here to help with that.
Awareness Metrics
The sales funnel, also known as the buyer's journey, starts with the awareness stage. In this stage, a potential customer starts realizing their need for a solution to their problem or interest in a service or product. Most likely, they're Googling stuff or looking things up on social media apps.
This is when effective SEO and marketing strategies come in handy. By having a well-crafted strategy, you're increasing your visibility and awareness with your audience and potential customers.
To learn how effective your strategies are and how to optimize them, you need to measure various metrics. You can measure the metrics you should follow during the awareness stage through Google Analytics, Google Ads, social media analytics, and so on.
Next, let's dive into the metrics and how you can measure them.
Website traffic
Definition: Website traffic tells you how many users have visited your website during a specific period and how many times.
Website users refer to several individual users visiting your site, while sessions tell you how many times these users have visited your site. If your Google Analytics shows 100 users and 150 sessions in the previous week, it means that, on average, each user has visited your site 1,5 times.
How to calculate website traffic: You can see your website traffic using Google Analytics or other website analytics tools.
Why it should be measured: It's essential to know how many visitors enter your website - but following website visitors also allows you to understand your visitors.
Knowing and understanding who the visitors are, where they're coming from and how they found your site is a huge advantage. You can utilize this information to make decisions and plan marketing efforts according to what seems to work.
Device
Make sure your site is optimized on all devices. The common occurrence we encounter with smaller companies is that they focus only on desktop optimization.
This is a massive loss since 52.6% of all internet traffic is generated from mobile devices, meaning they might lose potential customers. In Google Analytics, you can easily find out how many website visitors are browsing your site using a desktop and how many are using a mobile device.
Geography
Knowing where your visitors are and what language they speak lets you better plan content and marketing campaigns to match your key audience.
Most likely, a significant share of the traffic comes from the country where your company is located because of Google's local recommendations.
Furthermore, the language and different language versions of your website significantly affect where people are visiting your site.
Demographics
Google Analytics can even tell you what age group your website visitors belong to and what gender they represent. Planning your website content and offers based on your website visitors' demographic information is an effective way to boost your online sales.
Channel, source, and medium
Every ecommerce manager should be aware of their most effective traffic channels, sources, and mediums. Channels tell if the visitor has found your website, e.g., organic search, paid search, or social media. Other most common channels of traffic are direct, referral, and email.
The source splits the channels into smaller pieces. For example, social media can be divided into Facebook, Instagram, and Twitter.
Lastly, the medium can tell, for example, whether the traffic from a specific source was generated by a paid campaign or organically.
The Campaign URL-builder is a helpful tool if you want to follow the performance of your different ad campaigns with Google Analytics.

Engagement metrics
Engagement metrics measure how much your existing or potential customers are drawn to the content you publish and how much they interact with your brand. High engagement rates, no matter the platform, means that the content you're creating is exciting and catches your buyers' attention.
Engagement is essential to collecting data and gaining insights for a better understanding of your audience. You want to measure these metrics to ensure that the effort and money you're putting into your strategies are paying off.
This information shows precisely what works for your audience and what seems to be the most effective form of communication and topics. Understanding what kind of content seems to draw the most attention allows you to make informed decisions on the content you're producing, the structure of your website, and the keywords you're using.
You can measure the engagement of almost all of your content (blogs, social media posts, and newsletters) and your website. Let's look at what you should be keeping an eye on.
Website engagement
Following your website engagement levels is essential because it tells you clearly if people are visiting your website and what they're most interested in. Based on the information, you can see what is working on your website and what's not: is the site smooth to operate? Is the information easy to find? What about the checkout process?
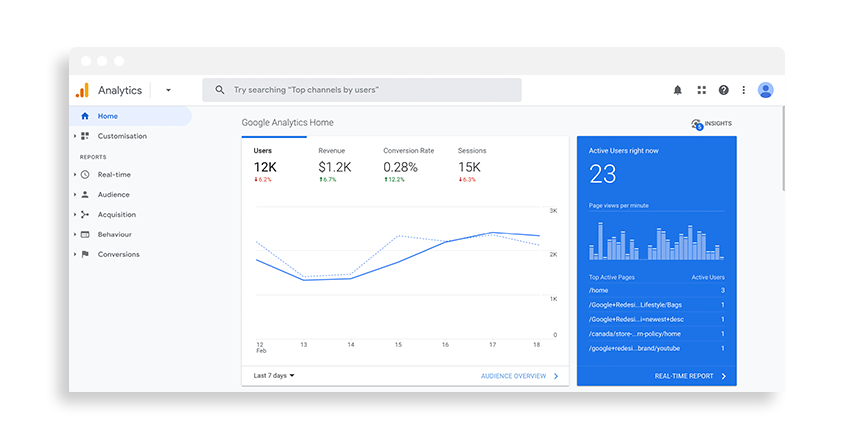
Many website hosting services have great tools for tracking website metrics, but the most used one is Google Analytics. It may take a little bit to figure out what's what, but it's a great platform that gives you detailed information on the different engagement levels during different periods.
In Google Analytics, you can find engagement metrics under the Behavior section.
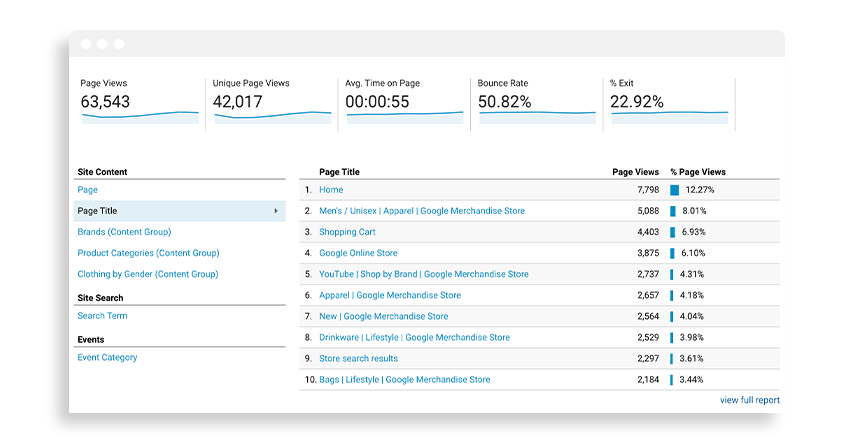
Pageviews
Pageviews show the overall number of pages that people have viewed in total. Because you can track individual pages on your website, it can help you understand your audience's behavior, what they're interested in, whether they find your website attractive, and if your marketing campaigns are producing results.
For example, if you're running a social media campaign and using a specific landing page, you can tell if the campaign is fruitful by seeing the overall page views of this landing page.
Bounce rate
A bounce is a single-page session on your site, so if a user opens a single page and then leaves without clicking on anything else, the Analytics server sees that as a bounce. You want to avoid a high bounce rate in any case, especially since a study found that bounce rate was closely correlated to first-page Google rankings.
A high bounce rate might indicate your audience is not getting what they expected when they click on your website. Whether it's misleading advertisements, messy website navigation, or something else, bounce rate helps you see if there's something off with the content or structure of your website that's standing in the way of conversions.
Average time on page
Average time on page measures the average time spent on a single page by all website visitors on non-exit pages. Exit pages are the last pages of a website session. According to a study, the average time on a page across all industries is roughly 62 seconds.
As you can probably already tell, a low average time spent on a page indicated that the user didn't find what they were looking for or generally didn't find your content interesting enough.
However, very high average time doesn't tell much either, since the time keeps getting measured even when the page is opened in a tab, just sitting in the background.
Just like any other website metric, it gives a better idea of how your website is performing by measuring each metric alongside other metrics to provide an accurate picture of engagement.
Email engagement
Email engagement measures how much your subscribers interact with your emails. By tracking email engagement metrics, you get a better understanding of what interests your customers, what kind of content triggers the most engagement, what kind of titles and copies you should be using, and even when you should be sending out emails.
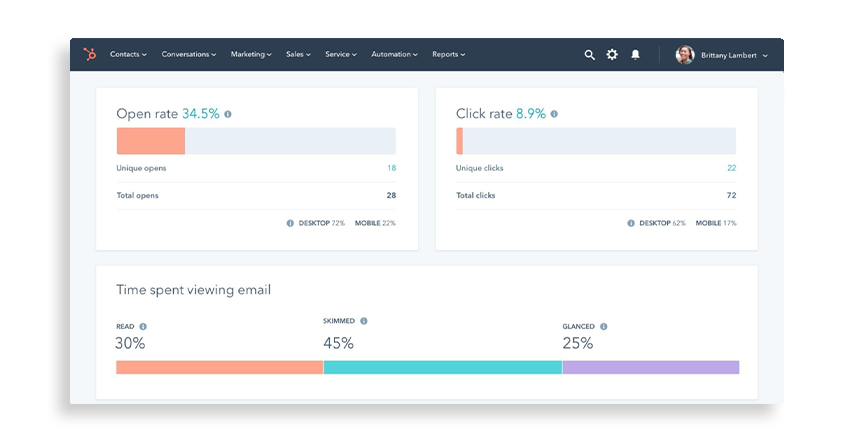
Most email marketing platforms like Hubspot and Mailchimp offer good and clear tools for you to measure the success of your email marketing campaigns.
As an example, here's what Hubspot's email analytics look like:
Delivery rate
The delivery rate tells you how many emails made it to your subscribers' inbox without bouncing. You can calculate your delivery rate by dividing the number of delivered emails by the number of emails sent. So why wouldn't the emails be delivered, and what's bouncing?
Basically, bounced emails can be caused by invalid email addresses that the email was sent to or your emails being marked as spam one too many times, so your recipient's inbox provider has automatically blocked you. There are multiple reasons why your emails might bounce, but those are the most common ones.
The delivery rate should be tracked consistently and stay above 95%. If not, it's time to review your recipient lists and clean them up. Additionally, ensure you're using mobile-friendly templates, optimizing your titles and copies, and ensuring your emails are not being marked as spam.
Open rate
Email open rate is, as you might have guessed, the percentage of recipients who open an email out of your total number of recipients. Remember that the email is only counted as opened when the recipient enables images in your email to be displayed or when the recipient clicks on a link in the email. Your emails' average open rate should be between 15-25%.
You should keep your eye on the open rate and whether it's improving over time. It gives you a better understanding of whether your audience is looking forward to your emails and whether your titles and preview texts are eye-catching.
This allows you to test out different content and test it on different segments to see what different audiences engage the most with.
Click-through rate (CTR)
If open rate measures the percentage of subscribers who opened your email, CTR measures the number of people who clicked on any of the content that's included in your email:
- hyperlinks
- call-to-actions
- and images
CTR is one of the most efficient ways to see whether your subscribers are interested in the content you're sending out and what particularly interests them.
Most email marketing tools let you see the links that were clicked the most, how many times they were clicked, and by whom.
This gives you a better idea of whether your content is interesting, whether the link placements are working, and whether your CTAs are clear and engaging enough.
Social media engagement
Social media platforms are one of the most efficient ways to increase your brand awareness and build a relationship with your followers. While striving for a large audience is a good thing, the most important thing you should be looking at are the engagement levels.
There's no use of large numbers of followers if the engagement levels are low, especially with how these platforms' algorithms work. To put in shortly: the more engagement your posts get, the higher your posts rank in visibility on other people's feeds.
Most social media platforms, like Facebook, Instagram, and Twitter, offer great tools for analytics and insights. If you have (which you should) a Facebook business account, you can see all types of metrics and insights.
Facebook Business Manager offers more in-depth analytics on the performance of your Facebook advertisement campaigns and offers detailed insights on how your money is spent.
Additionally, if you're using marketing platforms like Hubspot, they offer great analytics tools you can use to track different metrics.
Post engagement (likes, comments, shares)
Post engagement is the amount of time your post has been engaged with; basically, it measures the number of likes, comments, and shares your post receives from your audience.
When wanting to increase engagement levels, the focus should be on the quality of the content.
Take a look at your competition and how they're performing — knowing what interests your audience and benchmarking successful brands will give you a head start on creating highly engaging content interesting to your target audience.
As we mentioned before, engagement performance is not only about the ego boost of how many likes your post gets, but it also directly affects the visibility of your posts on different platforms.
Click-through rate (CTR)
Just like with emails, the click-through rate indicates the number of times people have taken action on your social media post or ad: whether it's clicking on a link or a call-to-action.
The reason this is so important to track is pretty straightforward: a low CTR means your choice of wording in the titles or copies isn't appealing enough to your target audience.
The problem might not be that your copies are wrong; you can just as well target the wrong audience, reach the wrong demographics, or even spend money on the wrong keywords.
Cost per click
When running social media campaigns, you want to track your cost per click (CPC). CPC is calculated in pay-per-click (PPC) type of ad campaigns, and as the name suggests, it's a metric that shows how much each click on your ad costs. For example, the average CPC on a Facebook ad is $1.72.
The reason why this is important to track is that clicks indicate the success of any PPC campaign. Conversion starts with a click, which is why it's vital to keep an eye on the ads on a regular basis and manage your ads according to their performance; increase the spending amount on the ones performing well and pause the ones that aren't performing.
Consideration and conversion metrics
After figuring out what they need, the customer moves from the awareness stage to the consideration stage. It's when the customers have identified what they want and proceed to start weighing their options.
This is the stage where you get to prove your expertise in the field and deliver to your potential customers all the needed information to help them make the best decision.
Once the consideration stage is done, we move on to the conversion stage. After weighing their options, your customers will make their final decision (hopefully in your favor, of course).
This is a crucial stage — your potential customers will most likely consult a sales representative, participate in a demo, or start going through the checkout process if they're shopping online.
Even if your soon-to-be customers have set their eyes on buying services or products from your business, it's still extremely important to ensure that all relevant information is available and that the check-out process is straightforward and effortless.
During both of these stages, there are multiple metrics that every business should follow. The metrics will help you understand the effectiveness of your marketing and sales strategies and help you optimize them. You can track these metrics either via good-old excel sheets or more efficiently through the tools provided by your ecommerce tool.
Cost per purchase
Definition: Cost per purchase (CPP), cost per acquisition (CPA), customer acquisition cost (CAC) — the loved child has many names. However, the meaning is the same: it measures how much you're paying for acquiring individual orders. Tracking your CPPs helps assess the effectiveness and profitability of your marketing efforts.
How to calculate CPP:
CPP = Total marketing costs / Total revenue
Why it should be measured: As a shop owner, you want to ensure that your investments in online ads and campaigns don't outweigh the generated revenue.
It's also important to remember that CPP should always be measured with your AOV to understand your success better. If your average cost per purchase is 50€ and your average order value is 100€ — you're doing well. However, if your AOV is equal to or lower than your CPP, you still have work to do.
Cancellation rate
Definition: The cancellation rate is the share of booked items or services eventually canceled from the customer's initiative. You can calculate the overall cancellation rate annually or during a specific period.
How to calculate cancellation rate:
Cancellation rate = Number of canceled bookings / Number of total bookings
Why it should be measured: For consumer businesses, calculating the return, refund, or cancellation rate is extremely important.
Because businesses in the rental industry work in a circular way where the products get returned to the store, it's more relevant to calculate the cancellation rate.
Of course, you want to keep your cancellation rate as low as possible to avoid any lost sales — booked equipment that gets canceled last minute leaves the equipment unused and takes away from customers that would go through with the booking.
One way is to set cancellation policies with transparent fees and to require payments in advance. Remember, a paying customer is a committed customer.
Customer churn rate
Definition: Customer churn rate indicates the rate at which customers stop doing business with you. Not to get confused with customer retention rate, the churn rate is a straightforward way of showing whether your customers are happy with your products or services or not.
Remember that churn rate is not the most suitable metric for every business model. But businesses that sell products through subscriptions or other forms of long-term rental services should definitely keep a close eye on the churn rate.
Depending on the industry of the business and the products and services you're offering, it's natural to lose customers over a certain period of time, especially if your offering is seasonal. Keeping this in mind, the churn rate in B2C industries is slightly higher, with the average customer churn rate in the consumer goods industry being 9,6%. So the goal is to keep your customers happy and your churn rate below 5%.
How to calculate churn rate:
Churn rate = (number of customers at the start of a period - number of customers at the end of a period) / number of customers at the start of the year.
Why it should be measured: This can occur for various reasons: the customer service is less than satisfactory, the customer base outgrows the need for the product or service, or the products or services are simply too expensive.
Average order value
Definition: Average order value is a metric that ecommerce businesses use in order to see and understand their customers' purchasing habits. AOV refers to the average amount of money spent per order, and businesses usually track this metric monthly or even weekly.
How to calculate average order value:
AOV = Revenue / Number of orders
Why it should be measured: Obviously, you want your customer to spend as much as possible while shopping on your website. So knowing your business's AOV helps you evaluate your overall marketing efforts, pricing, your online store's layout, product pages, and so on.
Tracking this metric allows you to benchmark and figure out what works best for your store and your audience in terms of increasing the shopping cart size.
Shopping cart abandonment rate
Definition: Shopping cart abandonment measures how many people add something to their cart but end up leaving the site without completing the booking.
The majority of ecommerce platforms offer tools to measure your cart abandonment rate. Also, Google Analytics lets you see at what stage most customers abandon their carts.
How to calculate shopping cart abandonment rate:
Shopping cart abandonment rate = 1 - (Transactions completed / shopping carts initiated) x 100.
Why it should be measured: The abandonment rate tells a lot about the different behaviors and if there's something off-putting in the checkout process that's making the customers leave.
Seeing clearly at which stage this happens gives you a better idea of how to combat the issue at hand and make your customers go through with their check-out process. Common reasons for shopping cart abandonment, to name a few, are surprising delivery fees and cumber or slow checkout process.
Sales conversion rate
Definition: Sales conversion rate is the percentage of people who visit your site to make a purchase. While it seems obvious to track, it's a good indicator of whether your marketing efforts are paying off as they should.
Most ecommerce platforms, as well as social media platforms, offer tools to track conversion rates.
How to calculate conversion rate:
Conversion rate = 100% x Number of sales / Number of users
Why it should be measured: Knowing and understanding your conversion rate can help you optimize your sales and marketing efforts and ultimately lower your customer acquisition costs by getting more value from your visitors.
For example, a high visitor rate but a low conversion rate could suggest that the visitors are expecting one thing and getting another, which drives them away from your site.
This all might lead back to slow pages, inaccurate communications of the offering, or just poor navigation on the site.
Retention metrics
Customer retention measures loyalty and continued interest in your business. It shows the number of customers that come back over a certain period.
Following and tracking retention metrics regularly is essential, as acquiring new customers is much more expensive than having old customers come back. It's all about nurturing existing relationships and using what you already have rather than splurging on extensive marketing campaigns to attract new customers.
Many ecommerce platforms offer great tools for measuring customer retention and loyalty. Additionally, Google Analytics lets you see the new versus returning website visitors. This already gives you a better understanding of the percentage of regularly returning visitors.
Repeat purchase ratio
Definition: Repeat purchase ratio, or RPR for short, is the percentage of customers who have returned to purchase from your business again.
It's an excellent way to track your customer retention strategy and can be used to enforce your sales and marketing strategies. It's a great indicator of customer loyalty too.
Of course, the repeat purchase ratio can be calculated over different periods, whether it be a week, a month, or a season. It all depends on the product and the industry your business operates in.
How to calculate repeat purchase ratio:
Repeat purchase ratio = the number of returning customers / Number of total customers.
Let's say that during season 1, your number of customers was 5,000. By the end of season 2, only 4,000 of those customers return to our business. In this case, our repeat purchase ratio would be 80% (4,000 customers / 5,000 customers = 80%).
You need a customer relationship management (CRM) system or another customer database to recognize your returning customers.
Why it should be measured: Especially for rental businesses, this ratio is great to keep track of since it's especially useful with individual products, as well as different demographics.
Getting a clear idea of which demographics are with the most repeat purchases and what kind of products are in question makes it easier to decide on marketing campaigns. This gives a better idea of which segments should be targeted and concentrated on the most.
Summary
Running a successful ecommerce business involves staying on top of relevant metrics throughout every step of the buyer's journey.
As we said, if you're not tracking any metrics, you're shooting with your eyes closed. Clear KPIs and data allow you to build scalable strategies, optimize online performance, increase conversions, and grow your online presence.
Start with baby steps, and get to know your platforms. Fortunately, most of the different platforms and marketing tools offer understandable and functional metrics and analytics, based on which you can make better decisions.
We hope this guide helps you better understand the different metrics and why you should be tracking them.